During week one, how did we do?
We had two workshops. Having anticipated a turnout of 65 for both, giving us a total of 130 participants, we ended up with 3 participants in the first workshop and 39 in the second.
Using our workshop model from earlier, we can establish an expected participation vs actual participation.
In our first workshop, it was half term, so many of the usual people who come along to Senses were unable to come to our session. This means we ended up with one participant who had two carers with him, Kale. I will write something up in a bit about Kale, because we had a great experience with him and his ideas were beautifully unexpected and dream-like.
We anticipated 65 people to workshop one, but ended up with four people for 90 minutes. This gave us a satisfaction rating of 75.6% and a concentration rate of 94.2% and an engagement of 84.9%. This bore out as all four participants took part in the task. We freestyled as Kale has autism and it is difficult for him to write and draw. We made him giggle and he made eye contact with both Emma and I which, we were told afterwards, is very unusual and special. Because Kale is not in our age bracket for evaluation, we have left him off our analysis (sorry, Kale). Sarah and Lisa, Kale’s carers helped him draw an amazing picture of a “mixed up animal” inspired by our chat about horses with a million eyes which also made him laugh. Kale’s brother is a prominent vlogger and raised money, surprising the team with his very generous donation. For now, I have deliberately left Kale’s brother’s name off this post to respect their privacy.

Hypothetical vs Actual Data
Engagement
In workshop two, we had 39 participants. Over 90 minutes, this gives us a satisfaction rating of 75.6% as before and concentration rating of around 43.5% which gives us a total engagement rating of about 59.5%. If we take this as a percentage of the whole group, this means that we would expect about 23 people will engage with the workshop.
In the end this is exactly correct – amazingly. 23 people engaged in the workshop and produced creative work. This is a very happy accident of data. Let’s see if the evaluation matches up too…
Evaluation vs Baseline
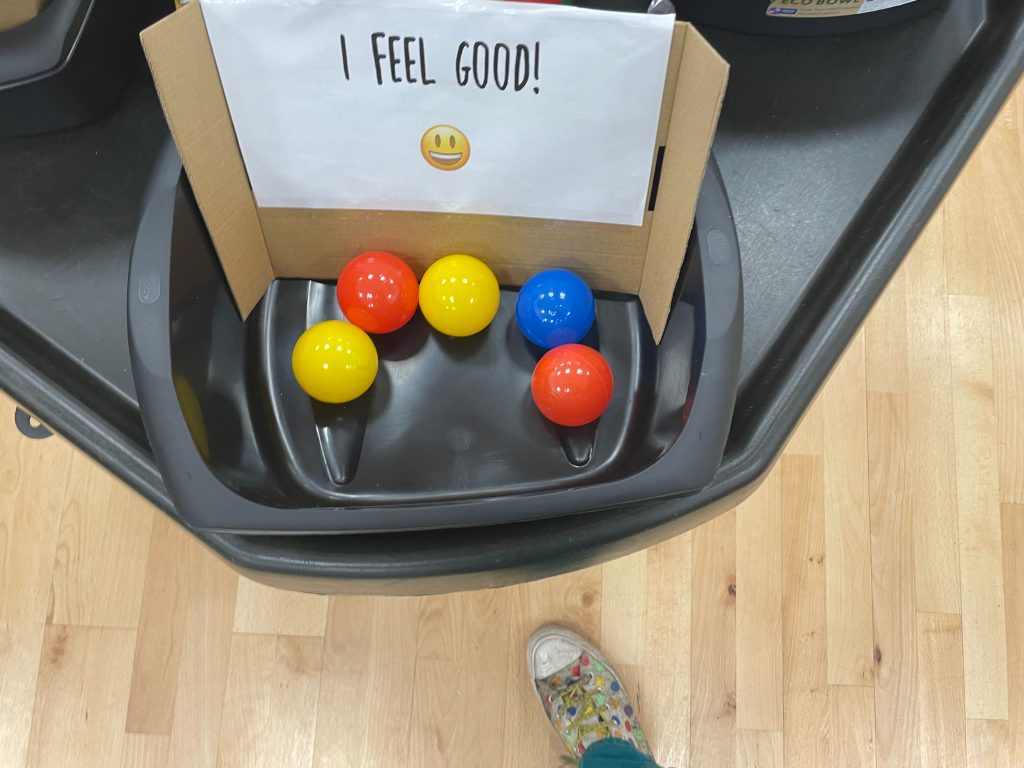
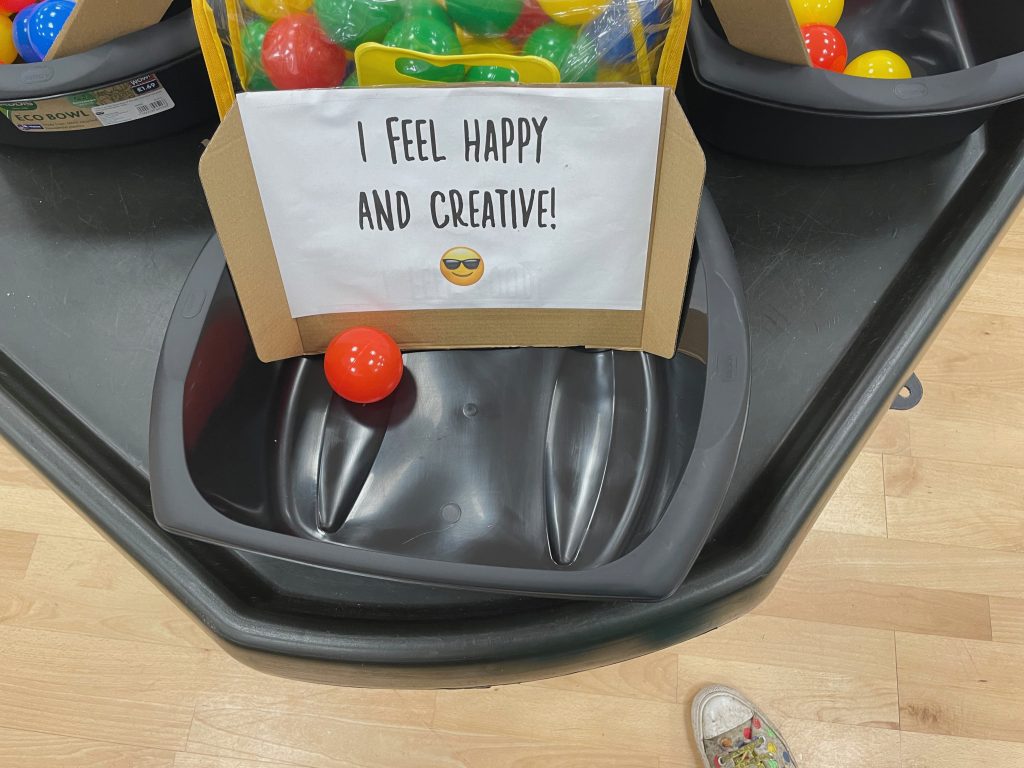
Our anticipated evaluation was to have around 75.6% of respondents say they were satisfied with the workshop. At the start of the workshop we asked participants to throw a ball into a bucket to tell us how they felt. Options were 1: I feel totally rubbish, 2: I feel okay, 3: I feel good and 4: I feel happy and creative.
We received 18 entries for this and here is the breakdown (numbers follow after these photos):


Baseline
Before the Start of the Workshop – 18 Respondents:
I feel totally rubbish: 1
I feel okay: 11
I feel good: 5
I feel happy and creative: 1
The percentages are then: Rubbish 5.5%, Okay 61%, Good 28%, Happy and Creative 5%
After the Workshop
After the workshop we had 27 respondents. As above, we anticipate about a 76.5% satisfaction rating. Let’s see how we did.


After the Workshop
I feel totally rubbish: 1
I feel okay: 2
I feel good: 9
I feel happy and creative: 15
This gives us percentages: 4% rubbish, 7% okay, 33% good and 56% happy and creative.
In the final analysis then, we had a satisfaction rating above average at: 89% feeling either good or happy and creative. This exceeds our anticipated 75.6% considerably, which is a lovely feeling!